Computer vision has a wide range of applications, one of them being object detection. As object detection can be used in both images and videos, it has become an important part of many different industries, from retail to the medical sector. When talking about the evolution of object detection, it is worth mentioning that it has been around since the middle of the twentieth century. Thus, this field of computer vision has already seen a few technological advancements.
Object detection models undergo a rigorous evaluation process to ensure the quality and performance of image recognition algorithms. The question then arises, how can we measure the effectiveness of both the object detection models and the algorithms they employ? We will dive deeper into several different topics to provide you with a broader perspective:
- Popular object detection metrics
- The most important datasets for evaluation
- Probabilistic Object Detection as a novel approach
- The challenges that object detection models face
These subjects will help you understand how to accurately evaluate and improve the capabilities of object detection technology, ensuring that it caters to different industries.
Metrics for object detection evaluation
In this section we are going to cover five different object detection metrics that help to learn more about the performance of object detection algorithms:
- Intersection over Union (IoU)
- Four main outcomes (TP/FP/TN/FN)
- Precision
- Recall
- F-Score
Intersection over Union (IoU)
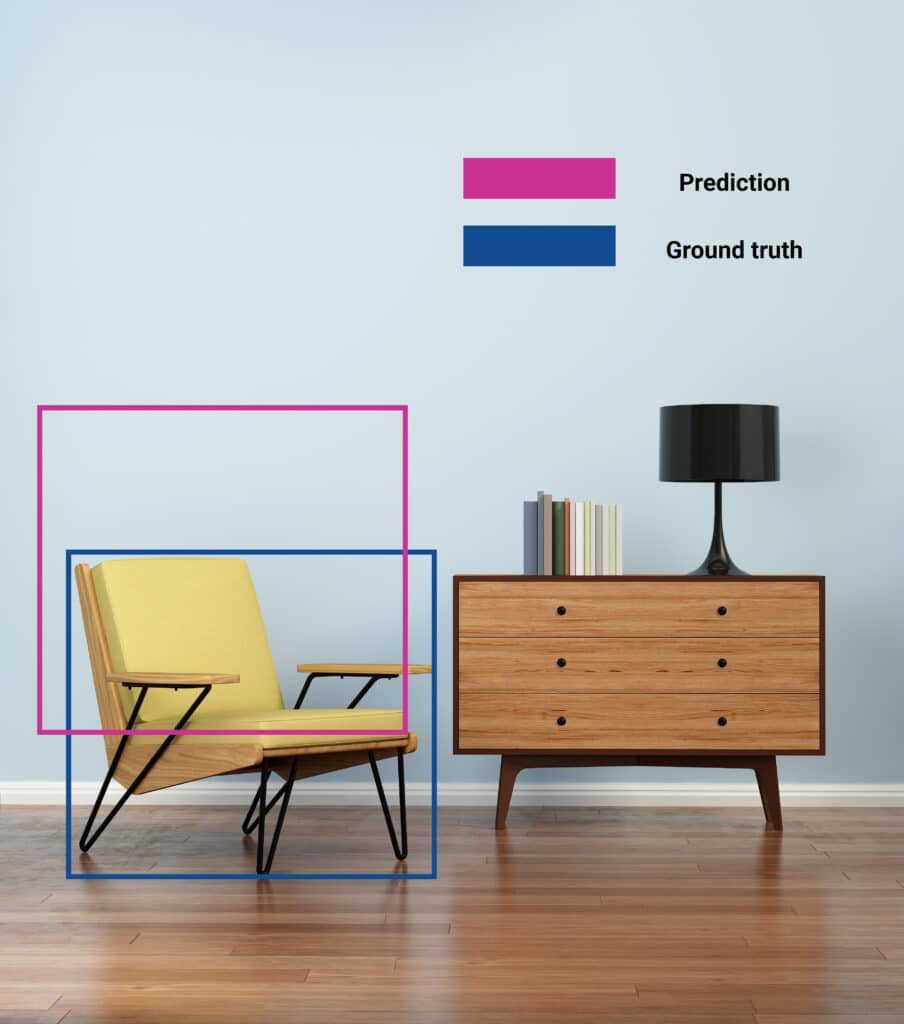
IoU is a popular object detection metric that measures the overlap between a predicted bounding box and the ground truth bounding box for a specific object. To understand IoU, let‘s define the difference between the two types of bounding boxes involved:
- Ground truth bounding box: This refers to the manually labeled location of an object. It serves as the foundation for evaluation.
- Predicted bounding box: This is the box the model generates around the object it thinks it has detected.

IoU is calculated by dividing the overlapping area by the total combined area. The final values of IoU range from 0 to 1, 0 meaning that the bounding boxes do not overlap, whereas the value of 1 indicates that both of the bounding boxes have the same coordinates. The values in between this range signify partial overlaps. In object detection evaluation, a common threshold for IoU is 0.5. This means that at least half of the predicted box needs to overlap the object’s ground truth location to be considered a correct detection. Some applications might require stricter thresholds, like 0.6 or 0.7, for higher precision.
Four main outcomes
Firstly, we would like to introduce the four main outcomes of object classification that play an important part in understanding the evaluation of detection models.
- True Positives (TP) are instances when the model correctly placed a bounding box around an object (e.g., it identified a dog correctly).
- False Positives (FP) are the cases when the model mistakenly placed a bounding box around an incorrect object (e.g., it mistook a parrot for a dog).
- True Negative (TN) is when the model correctly predicts something negative that’s actually negative. However, in object detection a large portion of the image background would be considered “true negative”. Therefore the primary focus is on the other three main outcomes, and not on TN.
- False negatives (FN) refer to instances where the model fails to identify objects that are actually present in the image. This means that the model misses objects that should have been detected. False negatives can be particularly problematic, as they represent cases where potentially crucial elements were overlooked.
It should be noted that the determination of TP, FP, TN, and FN all depend on two factors – the Intersection-over-Union (IoU) threshold (the ground truth bounding boxes and the predicted bounding boxes must overlap sufficiently) and the model’s ability to correctly recognize the class of the object.
In the following sections, we will show how common object detection metrics make use of these outcomes.
Precision
Precision is an object detection metric that focuses on indicating how many bounding boxes correspond to real objects, as it evaluates the reliability of the detections. To put it in simpler terms, it measures how many of the bounding boxes the model identified as a specific object (e.g., a “dog”) indeed contain that object.
This measure shows how confident you can be in the model’s positive predictions.
Precision is calculated using the following formula:
Precision = True Positives / (True Positives + False Positives)
Precision values range from 0 to 1 (or 0% to 100%).
High precision means the model demonstrates high precision in object detection, infrequently misidentifying objects within the target category (e.g., it rarely mistakes a parrot for a dog).
Low precision means the model often showcases wrong classification cases, frequently labeling non-target objects as part of the target category. This can result in a large number of false positives, which can be problematic in critical situations, such as life-threatening illness recognition (e.g., malignant tumors).
For a more comprehensive and reliable evaluation, precision is often considered alongside recall, which measures the proportion of actual objects that were correctly detected.
Recall
Recall, the counterpart to precision, tackles a different aspect of performance and can be measured using the formula below:
Recall = True Positives / (True Positives + False Negatives)
Just like precision, recall ranges from 0 to 1 (0% to 100%). Recall measures how well the model identifies all the relevant cases in a category. Let’s say we have a bunch of apples on a plate – high recall means the model identifies all (or the majority) of the apples. Whereas low recall signifies that the model misses a large number of the apples.

F-Score
The F-score considers both the model’s ability to correctly identify objects and avoid false detections by combining both precision and recall into a single value. The F-score is calculated as follows:
F1=2 precision recallprecision+recall
For instance, if a model identifies 3 out of 8 apples correctly but incorrectly labels 1 orange as an apple (meaning it identified 4 apples in total, one of which was the photo of an orange), it would have a precision of 3/4 and recall of 3/8, resulting in an F-score of 0.5.
A score of 1 indicates perfect precision and recall, while 0 indicates poor performance in one or both metrics.
Object detection datasets: Pascal VOC, COCO, and OpenImages
We’ll explore several important datasets that help evaluate and compare object detection algorithms. These datasets serve as a tool for evaluating and comparing the performance of different models.
Pascal VOC (Visual Object Classes) was an annual challenge that was held from 2005 to 2012. The challenge and its datasets have been regarded as an inseparable part of object recognition. The VOC challenge had two goals. Firstly, the researchers were given a bundle of challenging images together with thorough annotations so that everyone could use the same information to train their algorithms. Then, the performance of algorithms was measured each year1.
The 2012 edition of the challenge included three object recognition competitions: classification, detection, and segmentation, and remains the most popular version of the competition. The challenge covered 20 real-life object classes, including animate and inanimate objects.
Despite the conclusion of the Pascal VOC challenge, its annotated dataset with an extensive collection of categories remains one of the most used benchmarks for testing object detection models. As the dataset is still publicly available, researchers can use it, compare the model performance, and track the overall history of object detection evaluation.
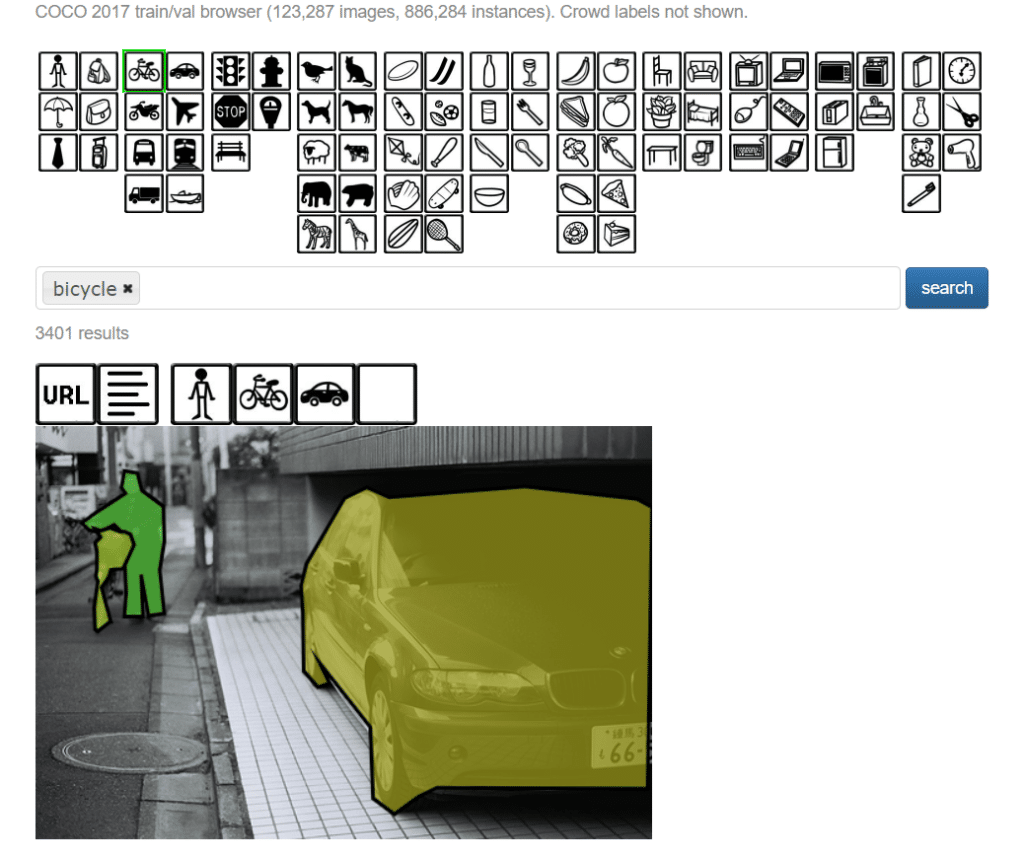
COCO (Common Objects in Context) should be distinguished for its scale and versatility. Encompassing millions of images, including over 1.5 million object instances across 80 categories, COCO provides data for object detection, segmentation, and image captioning. A defining characteristic of COCO is its emphasis on contextual understanding – objects are depicted interacting within real-world scenes, making it ideal for algorithms that require this broader visual intelligence.

The COCO evaluation measures provide an extensive framework for assessing object detection and segmentation algorithms, predominantly using Average Precision (AP) and Average Recall (AR) metrics. Both AP and AR are averaged over multiple Intersection over Union (IoU) thresholds, with the usage of ten IoU thresholds ranging from 0.5 to 0.95. Several other relevant aspects should also be noted:
- To provide a detailed performance summary, AP is averaged with specific scores at IoU 0.50 (AP50) and 0.75 (AP75).
- AR measures detection capability across IoU thresholds and object sizes, having 1, 10, or 100 detections per image.
- The protocol evaluates performance for different object sizes pixel-wise (small, medium, large) to ensure consistent model performance across various scales.
OpenImages serves as a collection of millions of images, which contains over 6000 categories. This dataset is growing continuously, which is a great addition to the field of object recognition. The repository offers a wide range of specific categories, thus enabling the algorithm to recognize obscure objects, types of drinks, or even fashion accessories. In addition, OpenImages showcases the relationship between objects (e.g., “woman playing guitar”). The ability to understand contextual information greatly impacts the performance of algorithms. As OpenImages is a work-in-progress with the data added by its contributors, it has become a comprehensive resource for object recognition.
Probability-based Detection Quality
As the world of Artificial Intelligence continues to grow, object detection will see more advancements. Introduced by Hall et al., Probabilistic Object Detection is a relatively new approach in computer vision that aims to detect objects in an image and gives high importance to the quantification of uncertainty2.
In their work, they introduce probability-based detection quality (PDQ), a new evaluation measure for object detections. PDQ assesses the accuracy of both labels and spatial positioning, without relying on fixed thresholds or adjustable parameters. It measures the quality of foreground and background separation and counts true positives (correct detections), false positives (incorrect detections), and false negatives (missed detections)3.
PDQ explicitly measures the quality of foreground-background separation. To put it simply, it assesses how well the model differentiates between objects and the background in the image. Additionally, PDQ also examines the accuracy of the spatial positioning of the bounding boxes.
While traditional metrics usually focus on detecting the object in general, PDQ also considers how well the bounding box is aligned with the object, regarding the actual location and size.
The challenges for object detection models
Object detection models face many different challenges as the scenarios for both photos and videos can be hard to read. Easy cases typically involve objects that have good lighting, are clearly visible, and are not fully or partially occluded by other objects. The difficult cases usually include objects that are blurry or fuzzy, are lit poorly, or have been covered by other surrounding objects.
These are the most frequent obstacles that object detection models face:
- Poor lighting: Object detection models can struggle to recognize items that are badly lit and classify them incorrectly.
- Occlusion: If an object has been covered or is surrounded by other objects that overlap each other, it can weaken the accuracy of the prediction.
- Blur and noise: Smudgy or blurry, low-resolution images can cause difficulties for the model to recognize individual objects in the photo.
- Size: Object detection models may struggle to find and accurately recognize small objects, especially if they possess all of the characteristics mentioned before.
Simplified object detection with SentiSight.ai
SentiSight.ai is a user-friendly platform that simplifies the process of object detection. To get started, simply upload the selected images to the platform and annotate the objects you want to detect. Create individual catalogues for each of your projects for a smoother dataset management. SentiSight.ai offers several pre-trained models to accelerate your project or allows you to train a custom model from scratch. Once the training is complete, you can utilize it for your unique needs.
Conclusion
The success of object detection models relies heavily on their performance. In this article we have discussed the basic principles of Intersection over Union, Precision, Recall, and F-Score metrics; we have also included the four main outcomes (True Positive, False Positive, True Negative, and False Negative) that help to better grasp the aforementioned metrics. The impact of the COCO, Pascal VOC, and OpenImages datasets was also discussed to provide a better view of how they help to assess object detection algorithms.
In addition, probability-based detection quality measure was introduced to highlight the growth of object detection advancements. By understanding these metrics and acknowledging challenges such as poor lighting and occlusion, the reliability and effectiveness of object detection can evolve further.
- Everingham, M., Van Gool, L., Williams, C. K. I., Winn, J., & Zisserman, A. (2009). The Pascal Visual Object Classes (VOC) challenge. International Journal of Computer Vision, 88(2), 303–338. https://doi.org/10.1007/s11263-009-0275-4 ↩︎
- Hall, D., Dayoub, F., Skinner, J., Zhang, H., Miller, D., Corke, P., Carneiro, G., Angelova, A., & Sünderhauf, N. (2018). Probabilistic Object Detection: Definition and evaluation. arXiv (Cornell University). https://doi.org/10.48550/arxiv.1811.10800 ↩︎
- Ibid. ↩︎

